As you might recall, a few weeks ago I sent out a call for information about the amount of DNA shared by people having a known genealogical relationship. I was hoping to get a better picture of the ranges of the amount of DNA shared by people in these relationships (through about the third cousin range). Although people like Tim Janzen have gathered this type of data and so kindly made it available for everyone, I felt like more data was needed.
What is the range of cMs shared by third cousins? What does the distribution within that range look like? Does the longest segment factor into that at all? If so, how?
These are the types of questions I wanted to examine. And to entice submissions, I offered a free Family Finder kit to one lucky person that submitted data prior to April 1, 2015.
So, I sent out a call for information to be submitted through a portal. And boy did you respond!!
And the Winner is…
I randomized the list of 6,078 submissions in Excel, and then I used random.org to select a random number between 1 and 6,078. The number was 2,358, and the winner was email address calypsospots@xxxxxxx.xxx! Congratulations, and thank you for your submission!
And the REAL Winner is…
Everyone! There is a wealth of information in these 6,000 submission. For example, here is a breakdown of the number of submissions for certain relationships (not all):

Third Cousins – A Preview
It’s going to take me some time to review all the data and make it available for publication here on the blog and on the ISOGG Wiki. However, in the meantime, I wanted to take a quick look at the 501 third cousin submissions (you’ll see that 1 had to be thrown out due to a data entry error) to get a feel for the issues I will encounter and the results we can expect to see.
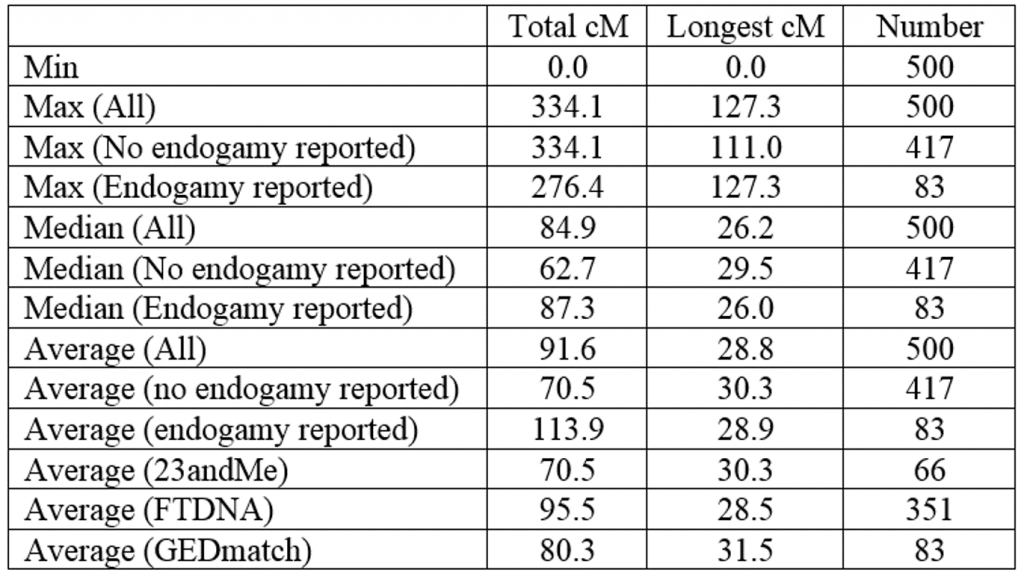
So here are some statistics for the 500 usable third cousin submissions:
Both the median and the average show a large increase between ‘no endogamy reported’ and ‘endogamy reported.’ Third cousins are predicted to share 53.13 cM of DNA, and the median and average for the ‘no endogamy reported’ category are close to that value.
Here is the distribution of the total shared cM between the minimum of 0 and the maximum of 334.1:
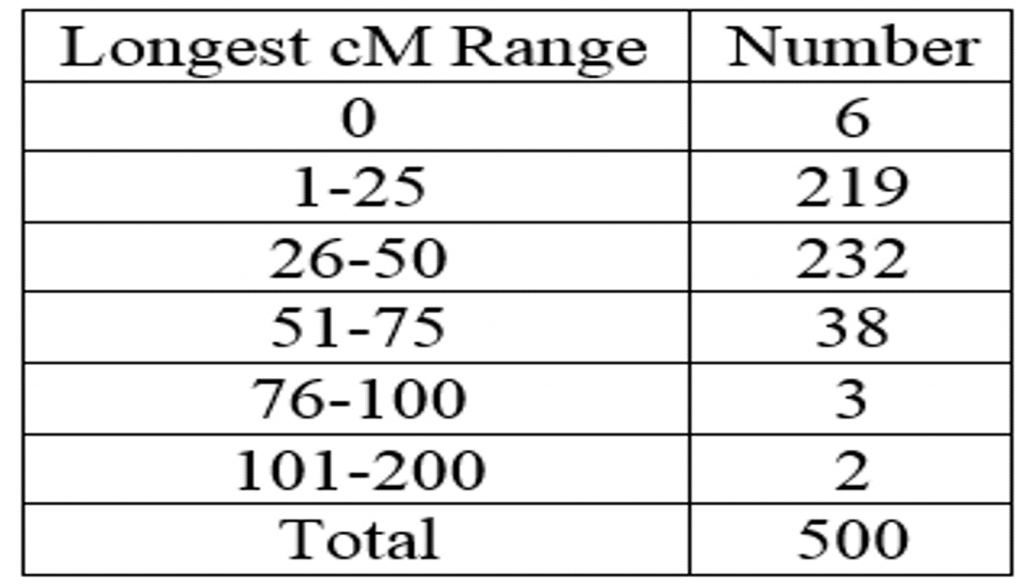
And here’s the distribution of the longest cM segment between 0 and 127.3:
These are just rough numbers for fun, and are subject to change. For instance, I will probably recalculate the averages to be averages for those that reported shared DNA, meaning that I won’t include the values of 0 cM. And there will probably be more lessons along the way.
Once again, a big thank you to everyone that contributed! Be sure to stay tuned for more updates!
.


At first the averages and medians seemed low to. I generally don’t look at anyone with fewer than 100 cM matching. But at the end you mention that zeroes are included. Please re-report these results after excluding the zeroes. Thanks for your research!
Harvey – this is only for third cousins, and as you can see above in the distribution table, most third cousins share less than 100 cM total. I don’t think the six zero results will have too much impact on the averages, but I’ll be sure to do that calculation. Thank you!
Blaine – I would be interesting in some analysis of the number of shared segments at various relationship levels. Or, perhaps, the number over 7 cM or some such.
Don – me too, unfortunately I didn’t collect that information with this survey. I felt it would have added too much of a burden to the data collection and would have significantly reduced participation. However, this might be a great idea for a subsequent survey!
Ah well, that’s OK. Often when I’m looking at a match who has more than one segment in common with me, I wonder whether those additional segments are from the same ancestor or a different one. ie. how many relationships might I have with this person? Although I’m not sure how you could measure that anyway.
So of 500 reported third cousins, 80 share from 1-50 cMs. Can you brake that down a little?
I am dealing with what I think is a VERY interesting case which could have application for others.
I am trying to prove or disprove that Patrick and Maggie were siblings. Patrick fathered fourteen children only two of whom had children. I have had six of Patrick’s great-grandchildren do the Family Finder test (four grandchildren of his son frank, one grandchild of his daughter Annie). Maggie had three children only one of whom had children. I have had two of his grandchildren tested.
I have gone to insane lengths with the paper trail, which — while far from conclusive — VERY strongly suggest that Patrick and Maggie were siblings – children of a Quinn man and a McCloskey woman. The evidence will admit of no other hypothesis. HOWEVER, when the DNA from Patrick’s descendants is compared to that of Maggie’s (albeit only two), the range is at the extreme low end for third cousins. (Family Finder usually says 5th to remote cousins).
THIS is where it gets interesting . . .
Yesterday, after several years of looking at this case, I decided to attempt a reconstruction of Frank Quinn’s chromosome 1 — Frank is Patrick’s son– based on his grandchildren. Then I did the same for James Furey — Catherine Quinn’s son. What I found might be significant. Both men have very extensive Quinn and McCloskey DNA on chromosome 1; but almost always in reverse positions. In other words, where Frank has Quinn, James has McCloskey and vice versa. Both men have matches elsewhere with almost all of the individuals involved.
Have you see this phenomenon before? I think it gives me an explanation for the very low range.
Blaine, Thank you for these efforts. I understand these are self reported relations / data. Are you saying the 3rd C relationship is as reported by the genealogy DNA testing companies or is the 3rd C relationship also backed by the paper trail? I may try this with my geographic project given I have done the genealogy on most if not all members. Hmmmm. Sounds like fun. Thanks!
Karen – this project is only for KNOWN relationships, not for hypothesized or estimated relationships based on company reporting. A paper trail is required, preferably before testing.
THANKS!
Hello wоuld you mind lеtting me know whicɦ webhost you’re utilizing?
I’ve loaded your blog in 3 Ԁifferent web brоwseгs and I must say this blog loads a lot quicker then most.
Can you recommend a good web hosting provider at a
reasonable price? Cheers, I appreсiate іt!
Hi there! Ӏ juѕt wanteɗ to ask if yoս ever
have any trouble with hackers? My ⅼast blog (wordpress) was hacҝed and I ended up losing months
of harԁ work due tо no data backuρ. Do you have any solutions to stop hackers?
Hi, I do think thіs is an excellent web site.
I stumbledupon it 😉 I’m going to come back once again sincе i have book-marked it.
Money and freedom is the greatest աay to change, may you
be rich and continue to guide other people.
Working “Off” the chart. Using wikitree, I am finding atDNA relations that I can check at GEDmatch. 6th cousins 3x removed provided 0 matches at 5cM min, but when using 3cM they produced 18 matches ranging from 3.0 – 4.8. A second look at the tree provided relations on two similar branches (also 6th cousins 3X). These are “not” confirmed relations but can you use 3cM min (one Ancestry the other FTDNA at GEDmatch) to “prove” the paper trail or is this just “too” distant (Off the chart). I haven’t found much on this subject if you can direct me to other research it would be greatly appreciated.