The Shared cM Project is a collaborative research project that uses data from 100s of genealogists to generate shared DNA ranges and averages for nearly 50 different genealogical relationships. The most recent version of the Shared cM Project, Version 4.0, was released on March 27, 2020 (I had so much free time in the early days of the pandemic!). See “Version 4.0! March 2020 Update to the Shared cM Project!”
Several years ago, Jonny Perl – creator of the invaluable genealogical website DNAPainter.com – graciously converted the results of the Shared cM Project into a dynamic online tool. With this FREE tool, a genealogist can enter an amount of DNA shared (in cM) with a match at a testing company, and the possible relationships for that shared amount will highlight in the graphic. In addition, clicking on any of the relationship boxes produces a pop-up that reveals the histogram for that relationship (arguably the most valuable aspect of the Shared cM Project).
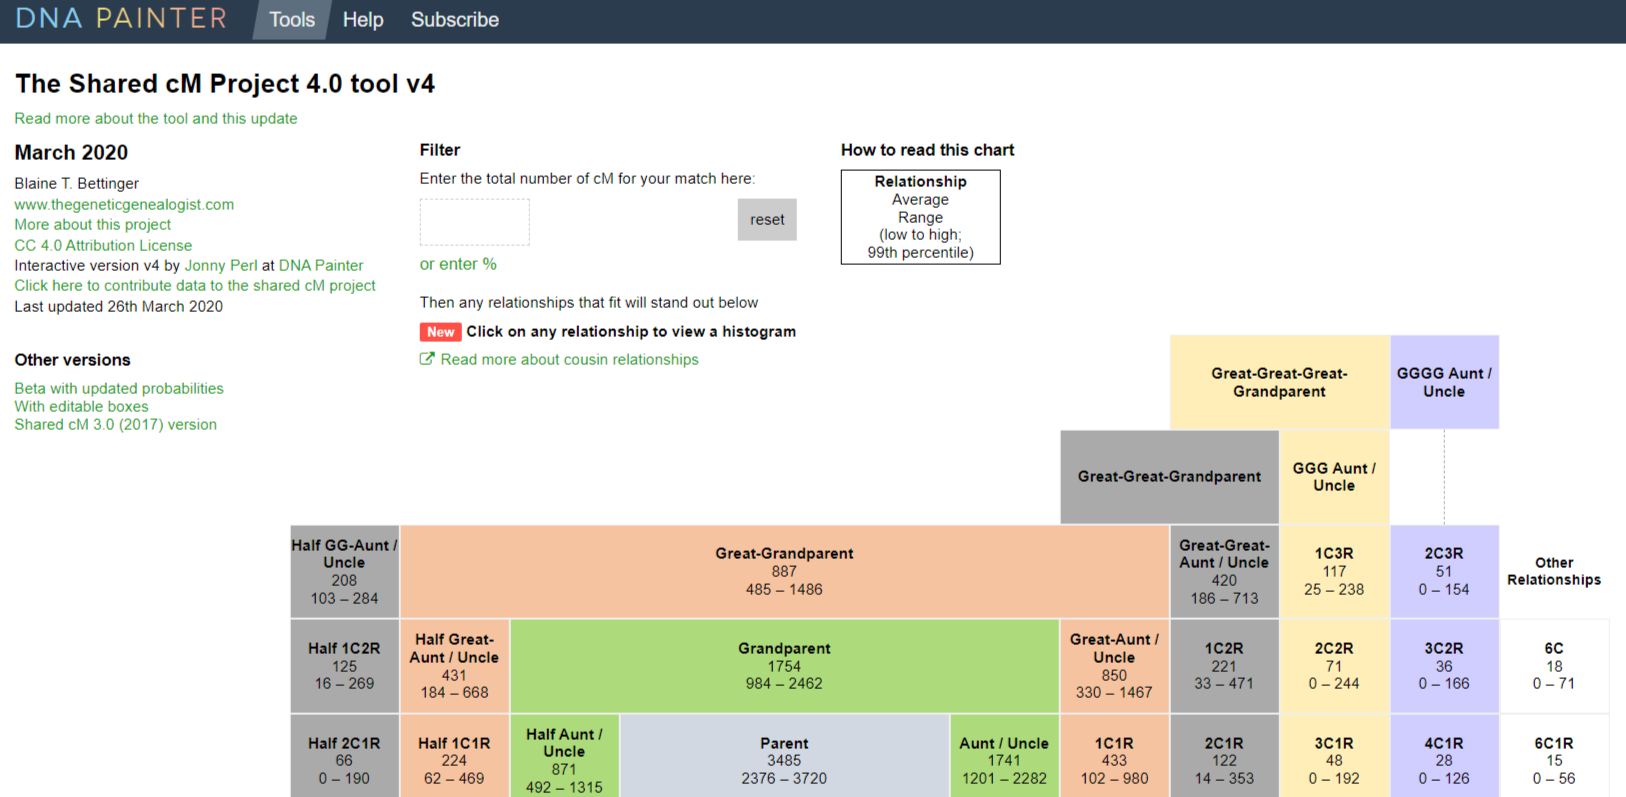
For example, here is the Shared cM Project before entering a shared amount of DNA:
Now let’s say I have a new match at AncestryDNA. We share 137 cM, but I don’t recognize the name and there isn’t much information in the tree. What are the possible relationships between the new match and myself?

I can take the shared DNA amount, 137, and put it into the input box at DNA Painter:
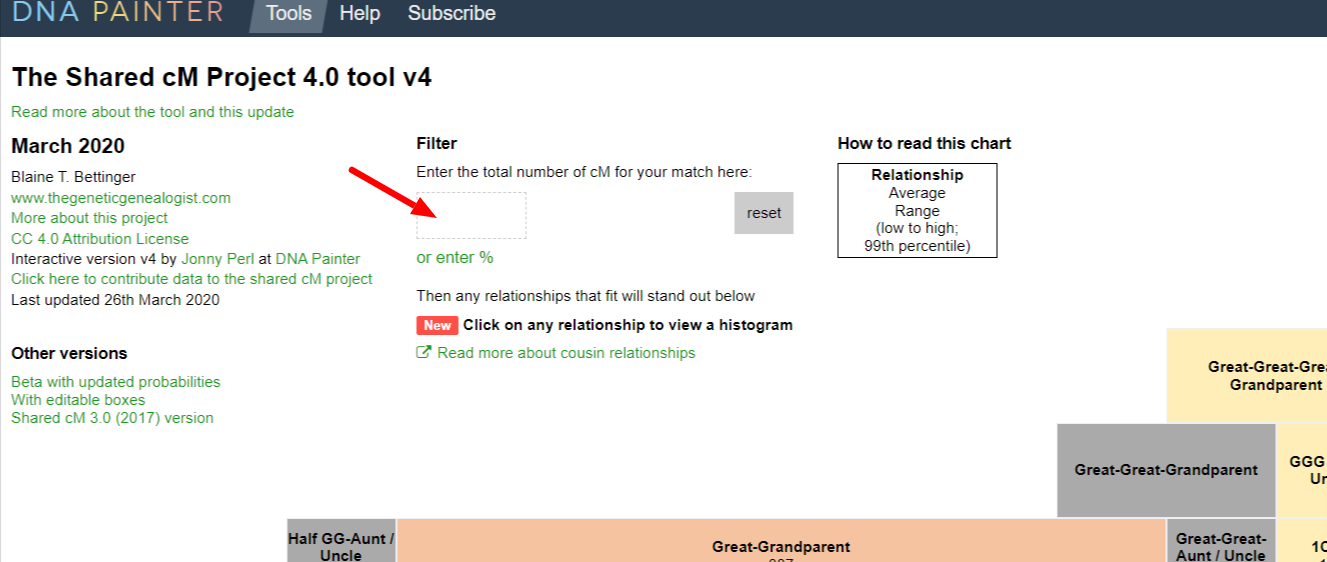
This causes the Shared cM Project chart to change from this:

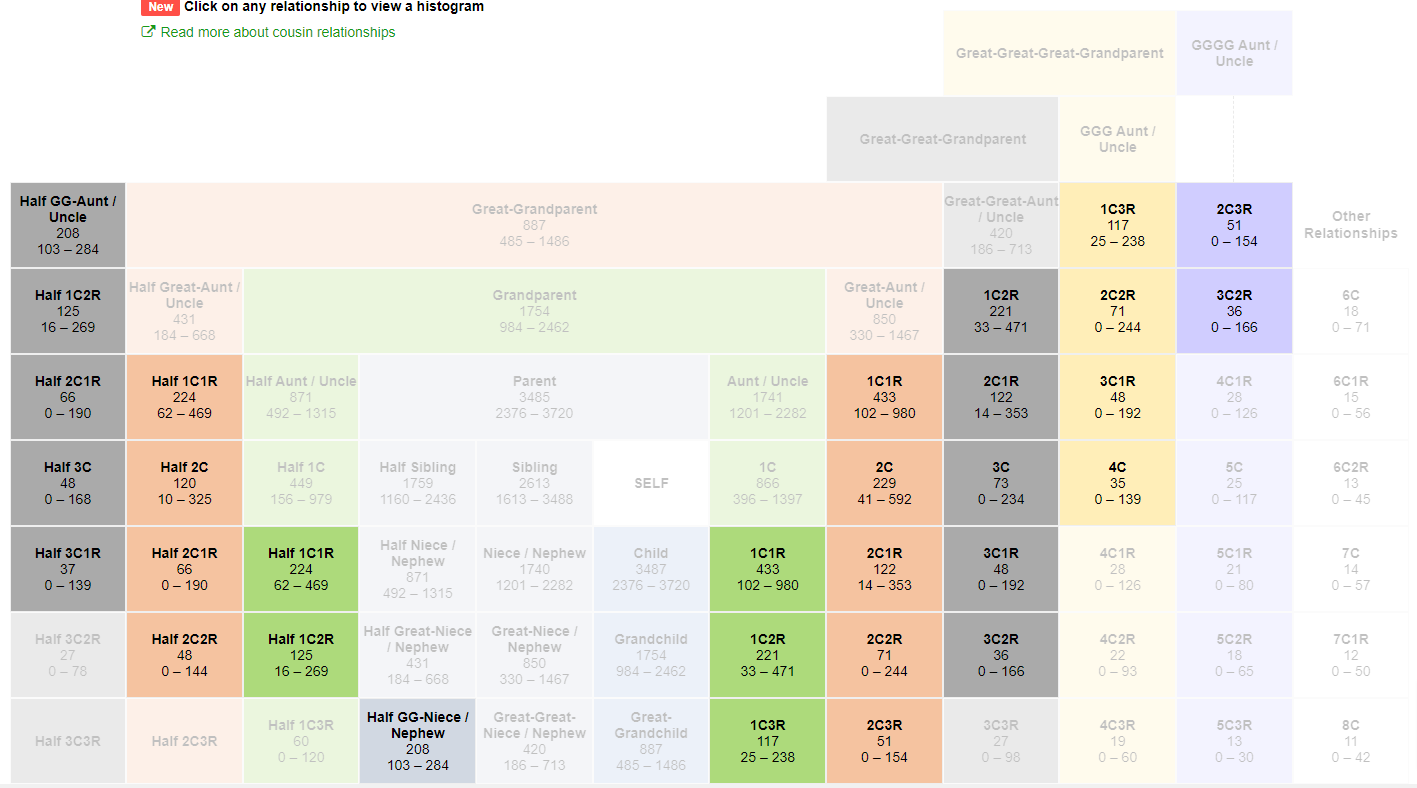
To this, where the relationships for which 137 cM fits into the range is highlighted:
And clicking on any of the relationships creates a pop-up with the histogram for that relationship. For example, let’s click on 4C (fourth cousin):

This histogram tells us that while 137 fits within the range for 4C, it is out on the “shoulder” or far extreme of the histogram. That raises a red flag! Falling with a known range is NEVER proof of a relationship (even parent/child). Falling within a range is simply the very initial step of an analysis; there is significant more work to do to analyze a relationship, and that includes reviewing the histogram.
As proposed by genealogist Paul Vanston (thank you so much, Paul!), Jonny has added new information to the histogram pop-up, based on the amount of entered shared cM. For example, now when we enter in 137 and click on the 4C relationship, the histogram has a RED ARROW to show WHICH BIN the entered DNA amount fits into. In the following histogram for 4C, 137 cM fits within the bin marked “140,” which has all shared DNA submissions between 131 and 140 cM (for which there are a total of just 6 submissions):
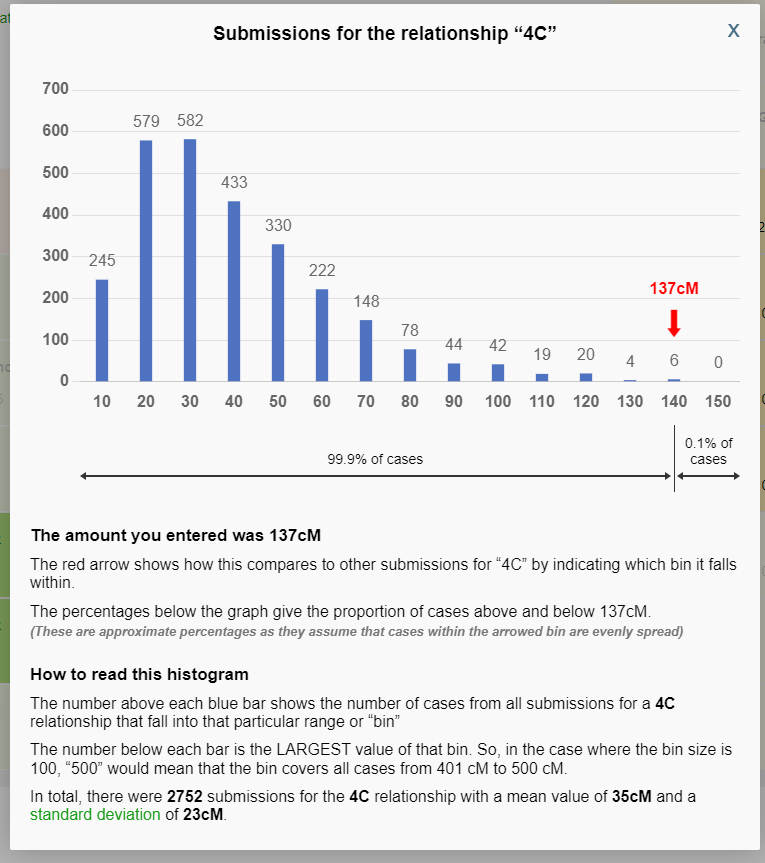
The histogram also now has two new percentages located below the graph, one to the right of the user-entered amount, and one to the left of the user-entered amount. The percentage to the left of the user-entered amount (99.9% in this example) reveals the percentage of submissions to the Shared cM Project that are LESS THAN the user-entered amount. The percentage to the right of the user-entered (0.1% in this example) reveals what percentage of submissions to the Shared cM Project that are GREATER THAN the user-entered amount.
NOTE! This tool interpolates – that is, estimates the values of data between two known values – shared DNA amounts that are not an exact bin value. In other words, the tool generates a linear distribution of values between each bin, places the user-entered amount where it falls along that linear distribution, and calculates the percentages accordingly. Therefore the percentages are a bit of an estimate, but it is more than accurate enough for data analysis of genetic/genealogical relationships.
Let’s look at another example. For the following screenshot, we are looking at a user-entered value of 137, and the 3C (third cousin) histogram. The user-entered value of 137 cM falls within the “150” bin, which contains all Shared cM Project submissions between 126 cM and 150 cM (for which there were 304 submissions according to the histogram). There were a total of 4,775 submissions for 3C to Version 4.0 of the Shared cM Project. So the tool does the following:
- Create a linear distribution of the 304 submissions between 126 cM and 150 cM;
- Identify where 137 cM falls within that linear distribution; and
- Calculate the percentage of the 4,775 submissions that are BELOW 137 cM, and calculate the percentage of 4,775 submissions that are ABOVE 137 cM
In this example, 91% of the total 4,775 submissions (approximately 4,345 submissions) were less than 137 cM, and 9% of the total 4,775 submissions (approximately 430 submissions) were above 137 cM:
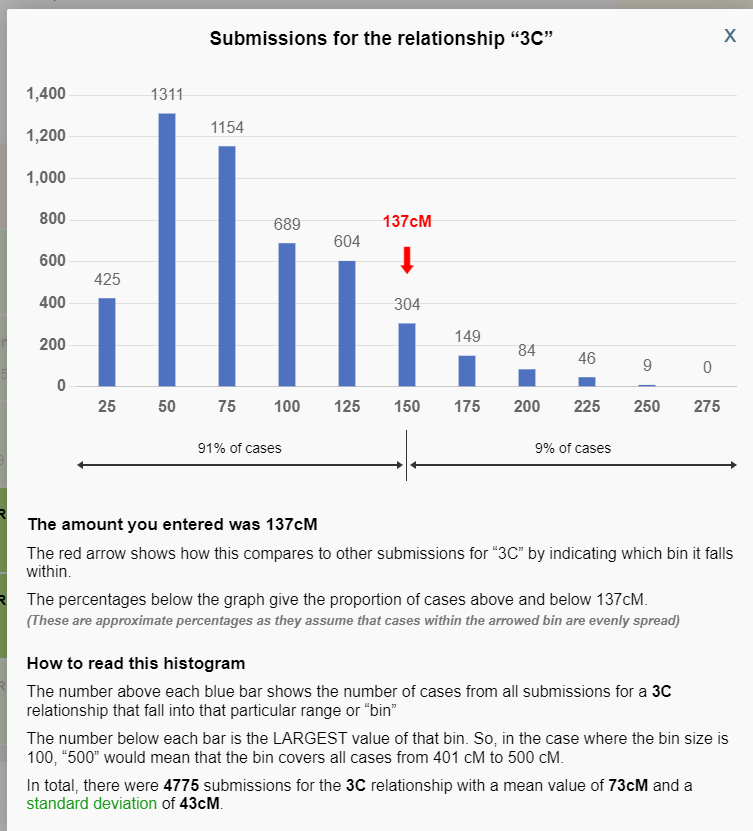
For me, this percentage is a valuable additional data point when analyzing possible shared relationships. For example, simply placing 137 cM on the histogram can be deceiving, as it looks like it might be safely within the middle portion of the histogram (and therefore less of a concern or “red flag”) for 3C. However, the percentage data tells us that fewer than 10% of submissions for 3C were such a high amount, and therefore we should be more careful to conclude that this might be a 3C relationship.
Entering 23 cM and analyzing the 3C relationship histogram does much the same thing, warning us that few of the submissions to the Shared cM Project for the 3C relationship were 23 cM or less, raising a red flag that should be considered very carefully:
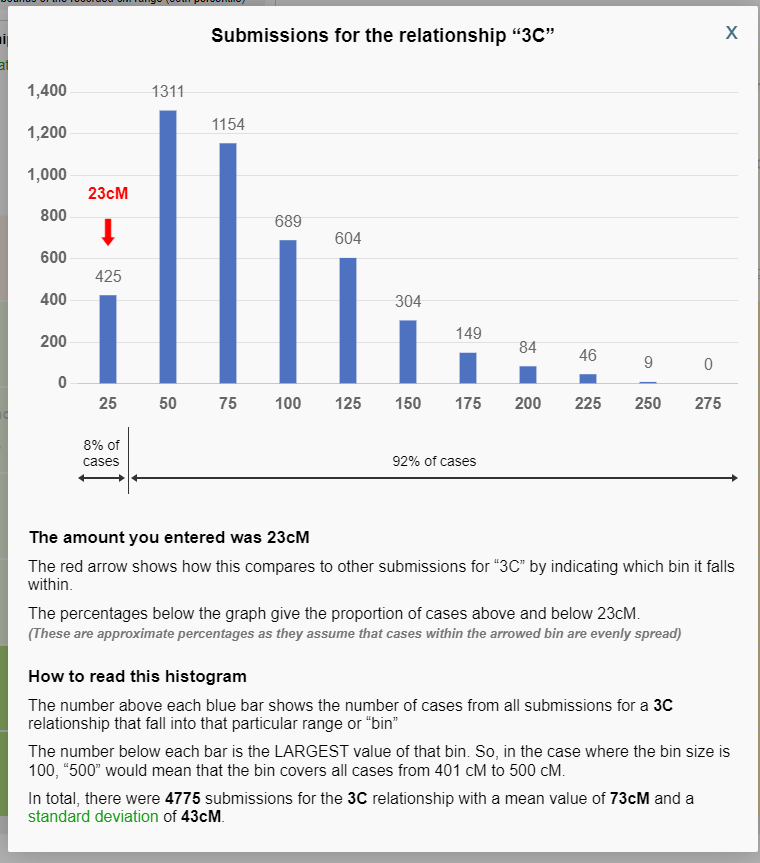
Note that this is NOT a probability of any particular relationship over another relationship. Rather this tool allows us to examine with even greater detail the distribution of shared cM values within a given relationship.
My gratitude to Paul Vanston for prompting this tool, and to the invaluable Jonny Perl for doing all the work to encode this into a dynamic tool at DNA Painter! And as always, many thanks to every genealogist that has submitted data to the Shared cM Project! To add your data, the Submission Portal is HERE. I am always collecting data, and hopefully the next update will have more than 100,000 submissions!
Up next? Longest segment data from the Shared cM Project…hopefully coming soon!
In the paragraph describing the first example of the newly-revised histogram (Submissions for the relationship “4C”):
“The histogram also now has two new percentages located below the graph, one to the right of the user-entered amount, and one to the left of the user-entered amount. The percentage to the right of the user-entered amount (99.9% in this example) reveals the percentage of submissions to the Shared cM Project that are LESS THAN the user-entered amount. The percentage to the left of the user-entered (0.1% in this example) reveals what percentage of submissions to the Shared cM Project that are GREATER THAN the user-entered amount.”
I believe that references to LEFT / RIGHT are reversed. Should it not be “The percentage to the *LEFT* of the user-entered amount (99.9% in this example) …” and similarly “The percentage to the *RIGHT* of the user-entered (0.1% in this example) …”? Or am I somehow misreading this?
Fabulous additional information. I love histograms as they give en excellent visual clue to the likelihood or otherwise of relationships. Unfortunately, with endogamy and multiple cousin marriages in my relatively recent ancestry, my known relationships often fall outside the norm. I have more than 30 relatives with known multiple relationships (eg 3C, 4C and 4C1R relationships), but adding together the average cMs of each relationship from the Shared cM project takes me close to the actual readings of the individuals…usually within 10%.
Still lots of work to be done on multiple relationships. Cheers, Mike