This data is shared under a Attribution-NonCommercial-ShareAlike CC license. You are free to share and use the information for non-commercial purposes, as long as you give proper attribution and release anything you create under the same license.
For a summary of all Shared cM Project posts, see “The Shared cM Project.”
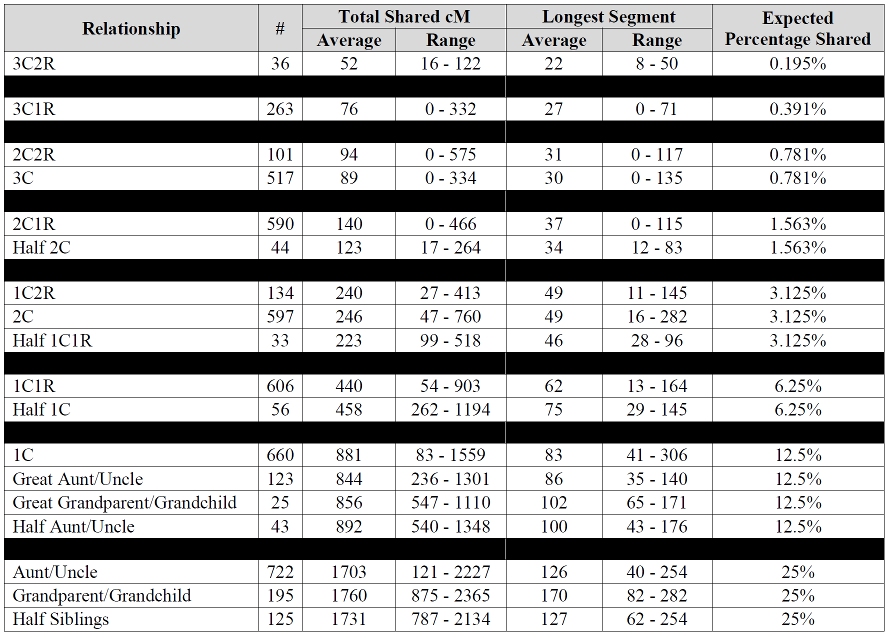
Are you interested in collecting any more data for your SharedcM project? I have 5 half sibs – 2 paternal and three maternal.
I share more cMs (and fewer segments) with paternal half sibs than with maternal half sibs- although all within the ranges you report. Is this a pattern you have observed?
I havde been trying to get my results and understand what I am reading.I am looking to see if I am Native American.How do I get my results???
I want to thank you for creating the project. I have been asking this very same question of everyone, especially the testing companies, the last few years. What is the mean and std dev between relatives sharing. But curious as to why you did not collect information for siblings? Am I missing something? I see the variation there as well. In fact, theoretically (although statistically minute), if a “perfect storm” crossover occurred, two siblings could be anywhere from 0 to 100% overlap of nuclear DNA. Am hoping to study some large families and even see if, anecdotal, very different siblings share less DNA between them. Especially fraternal twin siblings. Might want to consider converting to percentages as well. Felix Immanuel has the “correction” factors for each service / site values to get the proper percentages (although you may need to understand the source of GEDMatch values to apply the factors).
Randy – I did collect it and I have data for many hundreds of siblings. I just haven’t analyzed it yet. The need for it isn’t that great so it is pretty far down my list of priorities, but I’ll release it eventually, probably in the next few months.
I’m not a fan of the percentages, so I’ve intentionally avoided those. They’re just too inexact for a scientific study. And since a comparison should be based on total cMs and longest cMs, converting back and forth to percentages does nothing but eat up time.
Thanks for the reply (oddly, did not not get a notice of such). I only mentioned “percentage” because your charts show the collected cM shared (avg, min/max) but then list the percentage (as a number less than 1 so actually decimal form of a fraction). Seems would have been better to put that “expected value” in as cM to allow a quick apples-apples comparison of the expected with the avg sampled. My daughter, the biologist, likes to call these expected numbers “mendel genetics” values; indicating the very simplified, high level view they are derived from.
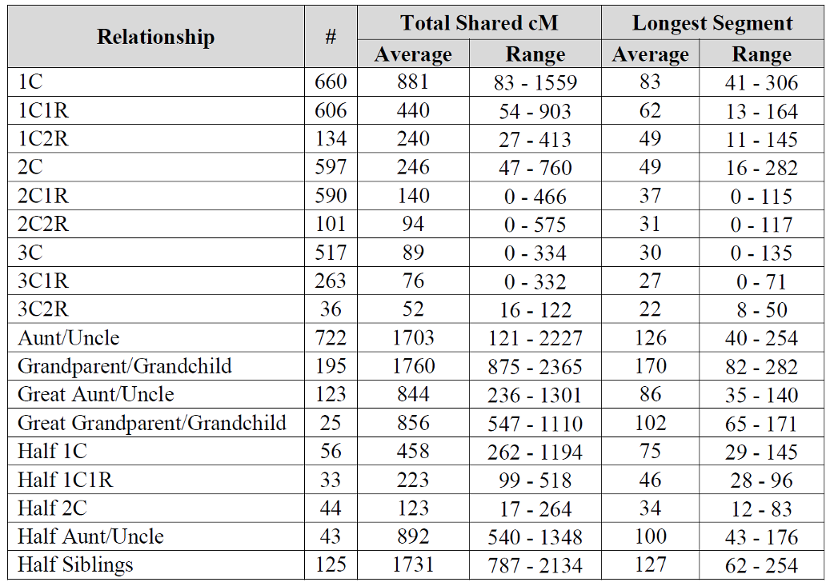
Wish this chart went to the 4-6th cousin level. Been seeing some larger matches there. I think I can explain it when I compare myself to my mother in matches. If it’s one segment, I often inherit it entirely or not at all, seems like the only time i get “part” is when there are multiple segments, when I may inherit only one of several segments. I think this may be why it seems to get results after the 4th cousin level that seem “inflated”. If my mother is a 4th cousin and I am a 4th cousin once removed and we both share 25 cM in common… I think you get my drift.
I just wanted to say that I have a 4th cousin once removed that I have one segment (Half IBD
82 cM ) This seems well outside the range the chart would indicate if it included 4c1r.
Specifically – chromosome 5, position 24968036-117506665, 81.87002 cM, 16518 SNPs
Regards
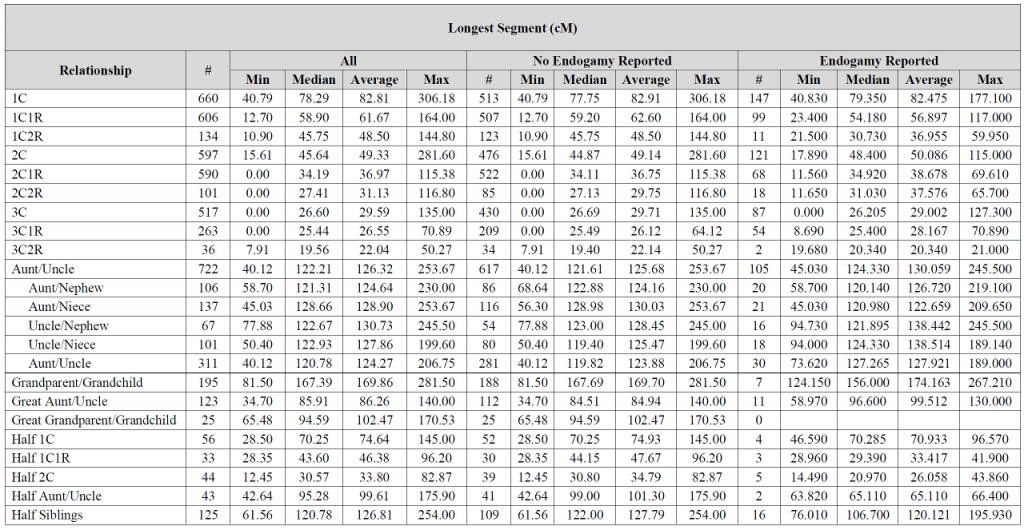
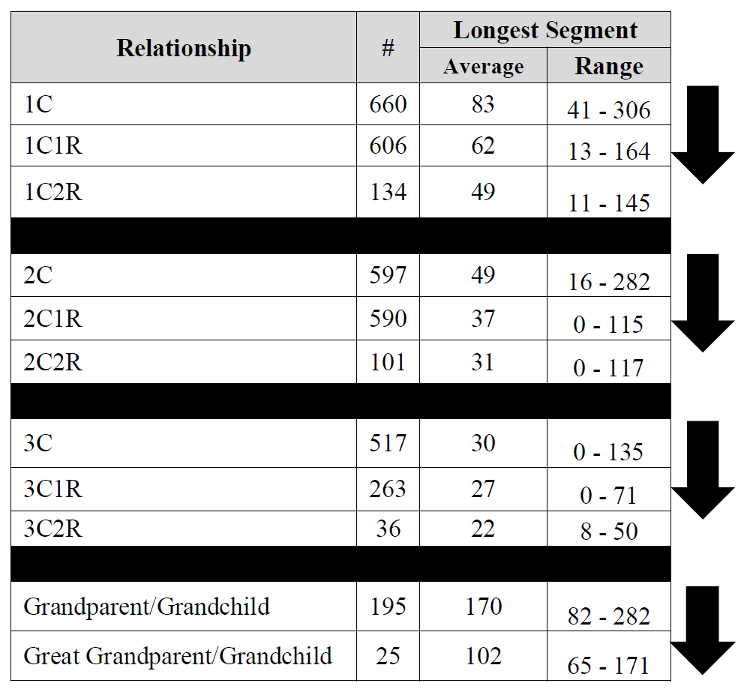
Blaine: I’m still learning when it comes to DNA, but puzzled why in the first chart, the longest segments are mostly higher where there is no endogamy involved vs when there is endogamy reported. I thought where there was endogamy there would always be more shared segments and that the segments would typically be longer? I must be missing something.
Any insight into the following match? Trying to figure this out and really could use some help.
16.2% Shared DNA
Half identical
1207 cM
26 segments