This post was inspired by an excellent post from Lara Diamond today entitled “Long Segment–But No Close Connection“.
What is DNA Segment Frequency?
In addition to segment size, segment frequency may be another important consideration for genealogists.
There are two ways to think about segment frequency: The first measurement of segment frequency is the frequency of a DNA segment among all humans. This is a number that is currently unknown, and can’t yet reliably be estimated even with simulations; there just aren’t enough people in the world who have tested yet. This is especially true for a segment that might be found outside of people with European descent as testing of these populations has been minimal or practically non-existent.
Segment frequency can also be thought of as the frequency of a DNA segment in a database. Although this is a relatively poor proxy for the frequency of the segment in a population or in the world, it is a proxy nonetheless (and until better ways to measure or estimate frequency are developed).
Why Care About Segment Frequency?
We care about segment frequency because segments that are frequently found within a population can cause issues when we are trying to assign them to a particular ancestor, or use them to support a genealogical conclusion. The more common a segment, the greater the probability that you could have inherited it from an ancestor OTHER than the ancestor you think it is! Additionally, it has been suggested that the more common a segment, the older the segment may be, which makes sense (although these studies tend to focus on the smaller segments that we should largely be staying away from – see HERE for more). The more time a segment has been around, the greater the chance that it could be widespread.
Here’s an analogy:
- I fill a bag with 100 M&Ms and tell two people to close their eyes and pick out 1 M&M each. If they pick out the same color, they win a prize. Their probability of winning a prize is dependent upon the frequency of the M&Ms colors in the bag. If I put in only two blue M&Ms, the probability that both will pick a blue M&M is very low and if they win, it is extremely meaningful. If I put in 50 blue M&Ms, the probability that both will pick a blue M&M is extremely high but their win is not very meaningful; it was bound to happen. The problem is, unless they know the frequency of the M&Ms colors in the bag, they can’t tell whether their win is meaningful.
That’s where we are: we know when people pick the same color M&Ms (i.e., when two people have large matching segments), but we don’t know how frequent those segments are in the population.
How Do We Analyze Segment Frequency?
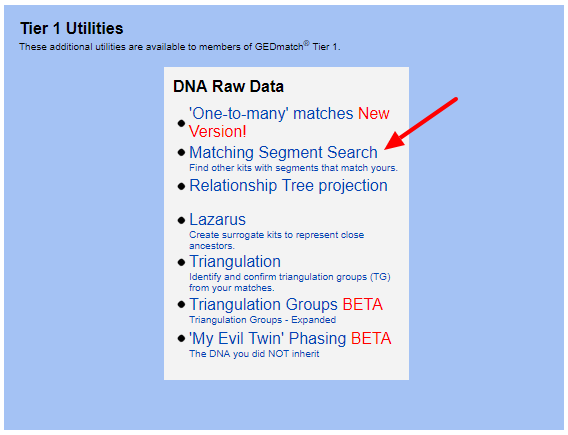
One way to analyze segment frequency using the database method (as discussed above) is to look for the segment in GEDmatch. For example, the Tier1 Matching Segment Search tool will identify the segments you share with your closest matches:
I ran the tool today, and I obtained segment data for my closest 9797 matches in the GEDmatch database. The default threshold for this tool is 7 cM and 700 SNPs. The threshold can be lowered to 5 cM and 500 SNPs, but no lower. So I can’t see segments that are 8 cM and 499 SNPs, for example.
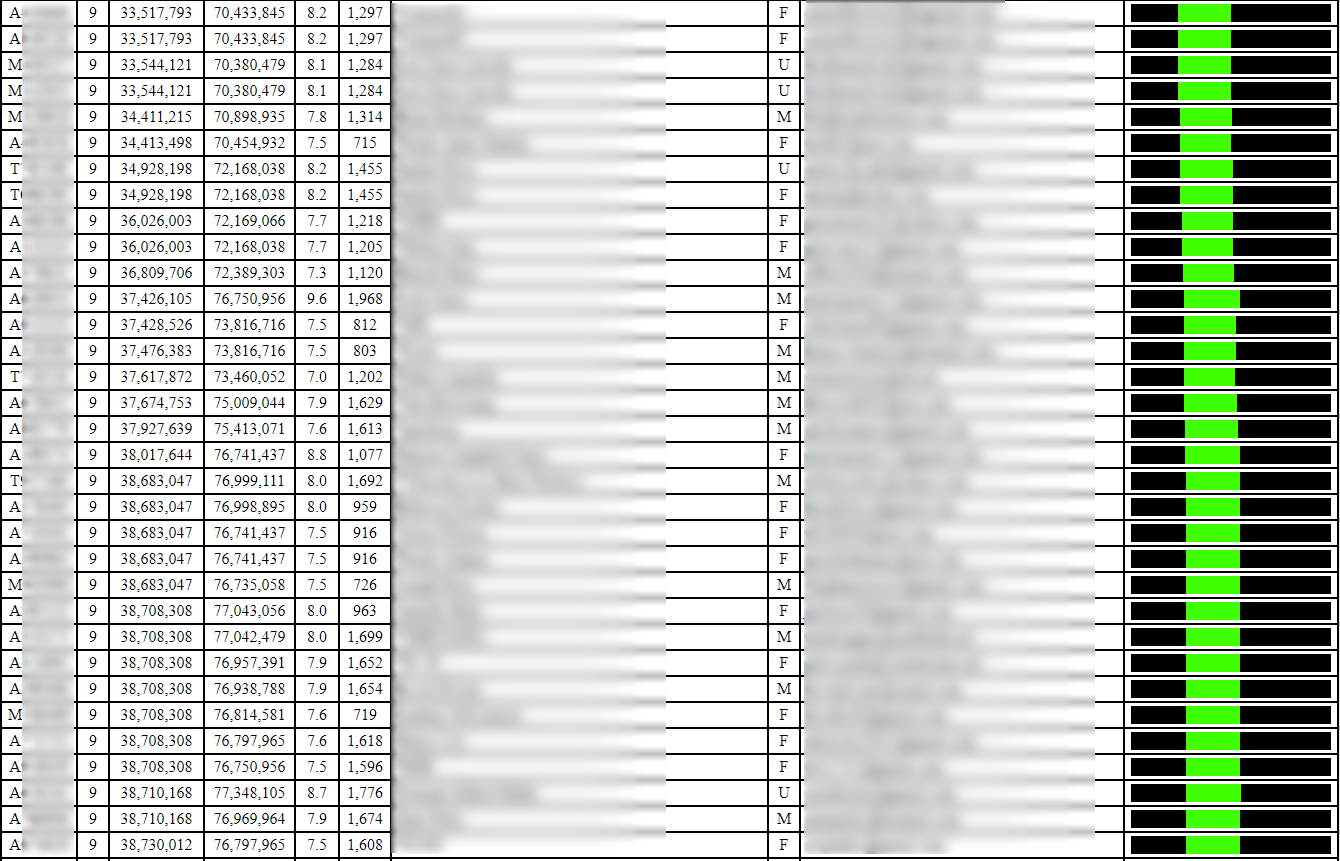
Some segments will be very common, and you’ll find lots of matches sharing that segment. For example, the following segment is small and appears to be shared by many, many people:
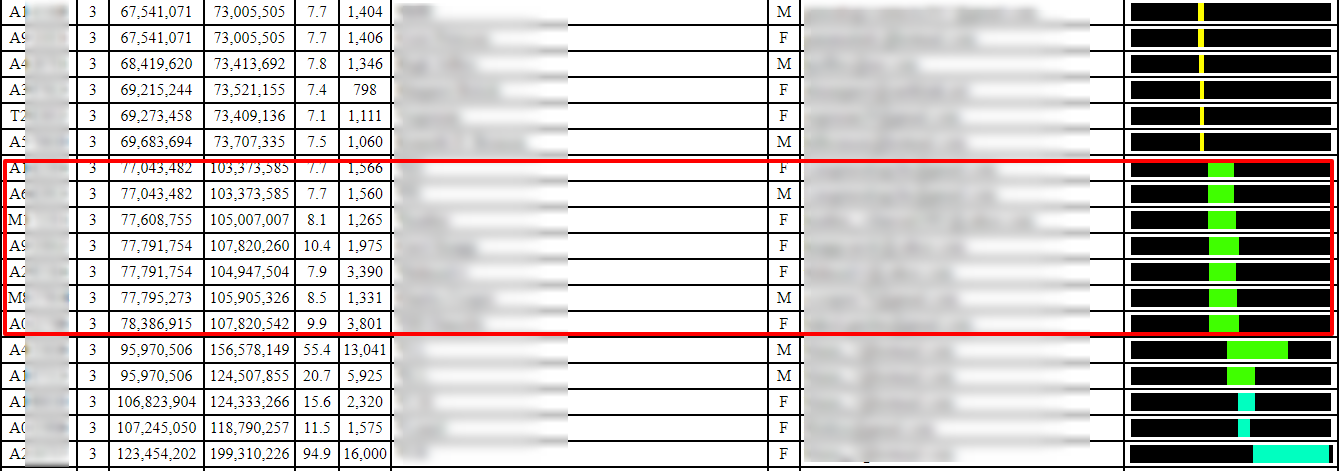
In contrast, the following 8-10 cM segment (in the red box) does not appear to be as widely shared (there are duplicates, so there are a total of 6 matches here, which form a triangulation group all sharing the segment in common):
This led me to wonder, how many of my segments at 7 cM and above am I seeing due to the default thresholds (7 cM and 700 SNPs)? Can I reliably use this tool to analyze segment frequency?
I took the results of my Matching Segment Search, removed my targeted test-takers (close relatives), sorted the segments by length, and plotted them. There were a total of 4,476 segments. Based on my interpretation, it appears that I’ve captured all of my 8 cM segments and above (with the 700 SNP threshold), but based on the curve I didn’t get all of my 8 cM or 7 cM segments (maybe because of the 700 SNP threshold):
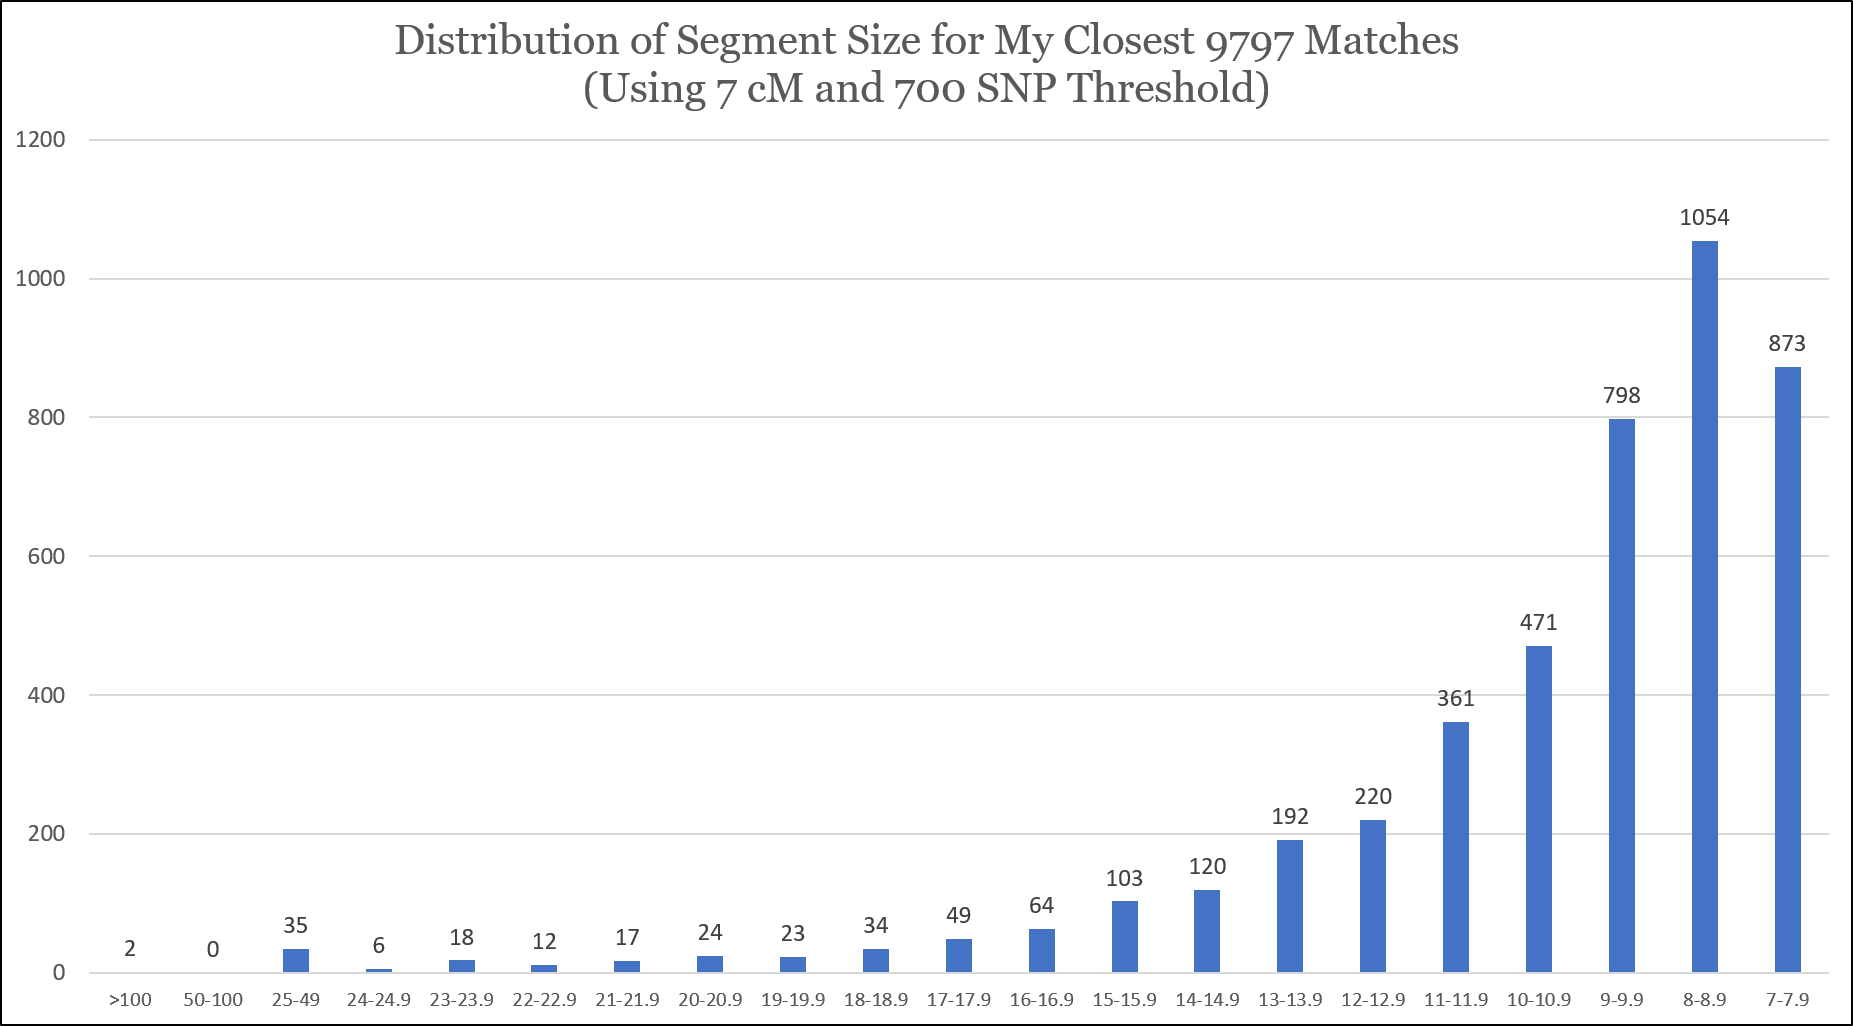
I’m concerned that I might have missed segments of 10 cM or smaller that have fewer than 700 SNPs, so I would be very, very cautious making conclusions in this range. Indeed, according to the “DNA file diagnostic utility” tool, I have 18,179 matches sharing 7 cM or greater, and the Tier1 One-to-Many tool reports that I have 19,061 matches of 7 cM or greater. My hypothesis is that these missing segments share fewer than 700 SNPs, but I can’t be sure with the current data.
Interestingly, when I lowered the threshold of the Matching Segment Search to 5 cMs and 500 SNPs, I was still seeing segments for only my closest 9797 matches in the GEDmatch database. So there is another threshold here that is being applied, and I’m not sure yet what that is.
When Should we Analyze Segment Frequency?
Arguably, we should analyze segment frequency when we’re relying on a segment as part of a genealogical conclusion. Sometimes this won’t be possible, such as if a test-taker tests at AncestryDNA but hasn’t transferred to GEDmatch. But, just as Lara Diamond did in the post linked at the beginning of this post, we should consider frequency whenever we can.
Example
In the following example, I’m very interested in the 20 cM segment shown in the red box. This is actually one person who has uploaded four of their own kits. Based on the analysis, it appears that no one else in the database shares that segment:
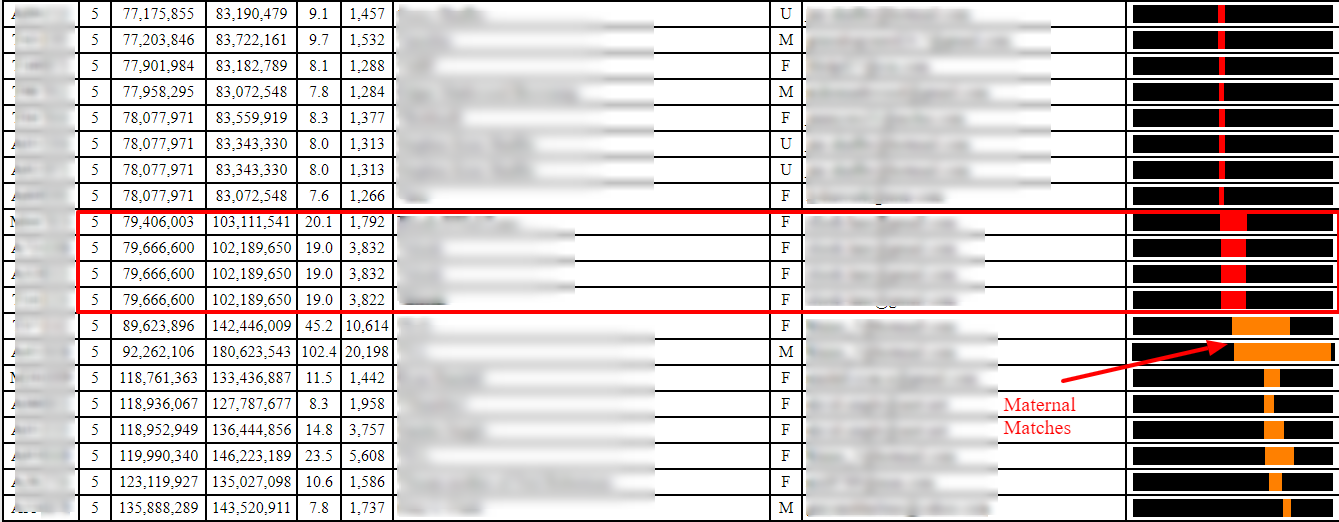
Now, I can’t necessarily make any conclusions based on LACK of high-frequency sharing of this segment. Tomorrow a bunch of people who share this segment may suddenly transfer to GEDmatch. However, it would be helpful if the analysis DID show high-frequency sharing of this segment. The best I can do here is report that I looked for others that shared that segment, and didn’t find any.
I read somewhere that the 80/20 rule applies to ancestors. There really may be a lot of people descended from an ancestral pair who match on that segment.
The other thing that might be in play is a common environmental adaption. The only SNPs being recorded for the genealogy companies are those that are subject to more frequent change. We have those genes to help us adapt to our environment. So events like the potato famine, war, the plague and other epidemics may have changed whole groups of people’s DNA.
Would you not also need to “one to one” adjacent members of the group of nominally matching segments in any given address range since Matching Segments does not reliably group matches by allele?
Blaine – see my blog post about numbers of Matches at https://segmentology.org/2017/05/17/amount-of-dna-vs-number-of-matches/
I have several Triangulated Groups – virtually every segment matches every other segment – with many Match-segments. Is this a bad pile up or a good pile – I don’t know for sure. What I am very sure of is that I got all the DNA in that TG from one of my two parents; and from one of my four grandparents; and probably somewhat further back – up one specific ancestral line. In many cases I have a 1C and/or a 2C and/or a 3C in the the TG. So I know if a 3C has that TG-segment (or a good part of it), probably most of the other Matches in that TG got their segment from the same Common Ancestor. I, too, have found TGs with Match-segments in the 20-40cM range for which we cannot find a Common Ancestor. In at least two cases I’ve reviewed my Matches’ Tree and determined an “adjustment” was in order, and then we had a Common Ancestor somewhat more in line with the cMs. But I have no doubts that some of the Match-segments in a TG may come from distant ancestors, outside the range of my Tree or the Match’s Tree or both. But I am just as confident that with a TG of 20, or 50, or 100 Matches, there is a distribution curve of cousinships. Matches with a 20cM shared segment are not ALL 4C or 15C – they are spread across this range. This means that there is a high probability that some percentage of them will be 5C or 6C or 8C or 9C – well within some parts of my Tree. We cannot tell, just by staring at the 20cM number, if it’s close or distant. So we have to review the tips of our Matches’s Tree and/or communicate with as many as possible to find matching place/times, and other genealogical clues that can help us sort it out.
As I read about segment frequency, and think about the biology, I can a case for some segments being more “sticky” than others. OK. For me this just means they may come from more distant ancestors, and be out of range. But among them are liable to be some that are closer cousins. The Matches are still pouring in….
Phasing sounds great. However for those of us with long deceased parents and only one sibling it is just not an option. Nevertheless, the science will continue to get better.
Susan – do you have a child tested? If so, you can pseudo-phase! https://thegeneticgenealogist.com/2017/07/26/the-effect-of-phasing-on-reducing-false-distant-matches-or-phasing-a-parent-using-gedmatch/
I was analyzing DNA frequency for my grandfather to understand if there is a genetic disease in our family. Our doctor will post his essay with results on https://paperwriter.com/ for us to see. I hope everything is fine and I will become a writer as I wanted to.