 Understanding the complexities of autosomal DNA can be very challenging for newbies.
However, there are a few basic tenets that I believe can help these newbies. These tenets are essentially tools that newbies can use to analyze an autosomal DNA problem for themselves.
For example, here are the two very basic tenets that I typically introduce in my autosomal DNA lectures especially for the newbies:
- Everyone has two family trees – a Genealogical Family Tree and a Genetic Family Tree – and the Genetic Family Tree is a subset of the Genealogical Family Tree; and
- You only have to go back about 5 generations to start losing ancestors from your Genetic Family Tree.
So many of the issues that newbies run into can be resolved or prevented through understanding of these concepts.
The Coop Lab
The lab of Graham Coop, an associate professor in the Department of Evolution and Ecology at UC Davis, maintains a blog where they often discuss genetics. Today they published an interesting blog post entitled “How much of your genome do you inherit from a particular ancestor? In the post, they perform a handful of different analyses using data they had for one generation of transmissions which was compounded over multiple generations.
For example, they also calculate the probability that you inherit zero (large) blocks of your genome from a specific ancestor, which is presented in a great chart. Interestingly, at about 7 generations ancestors may start dropping off of your Genealogical Family Tree. They also calculate the probability of inheriting zero blocks of your genome from a specific ancestor by chromosome. Definitely click over to the blog post to learn more.
Luke Jostins – Genetic Inference
The Coop Lab post is very similar to a 2009 post by Luke Jostins at Genetic Inference entitled “How Many Ancestors Share Our DNA?“, in which Jostins calculates the probability that someone inherits DNA from an ancestor. This is one of my favorite blog posts of all time, and Jostins’ calculations suggest that ancestors can start to fall off the Genealogical Family Tree at about 5 generations.
More Data! More Data!
There are some differences between the Coop and Jostins calculations, and it will be interesting to see these refined with better data. For example, these are the types of questions that large datasets combining detailed family trees and DNA (i.e., Genealogical Family Trees and Genetic Family Trees) can help answer.
For now, I may update my second basic tenet to say 5-7 generations.
Hi Blaine,
Thanks for the post. I’ve talked to Luke Jostins and we think that his calculations were slightly off. He’s now left a note on the top of his old post indicating this. I’ve now written another post on how many genetic ancestors you have. The figures there were inspired by the one you show here, but are generated using real transmission data. Do those types of plot have a name? Where did they originate from, or have they been around for a long time?
Thanks,
Graham
Graham,
Thank you for your work on this, it’s an important aspect of interpreting genetic genealogy testing data.
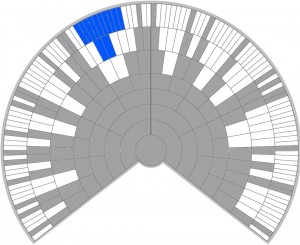
Regarding your question, the underlying charts (without shading) are called fan charts, and have been used by genealogists for many years for their Genealogical Family Tree (i.e., the tree of all their ancestors regardless of genetic contribution). As far as I can tell, I was the first to apply a Genetic Family Tree to a fan chart to create these colored plots; I was not working from similar charts when I created these. They don’t have a formal name that I’m aware of, although I call them Genetic Fan Charts.
Thanks again,
Blaine
Thanks Blaine!
Graham